
Shin Toriumi (NAOJ)
Solar flares and coronal mass ejections (CMEs), especially the larger ones, are produced from active regions (ARs). In order to understand the statistical properties of such ARs, we surveyed all flare events with GOES levels of >=M5 that occurred on the solar disk during 6 years from May 2010. We found that out of 29 ARs that produced a total of 51 flares, more than 80% show delta-sunspots, the most complex magnetic configurations. Flare duration was found to be linearly proportional to the distance between the two flare ribbons (chromospheric brightening during the flare), which is well in line with the flare model based on the magnetic reconnection theory. It has been known that some flares do not accompany any CME eruptions. Our statistical results show that the ratio of the ribbon area to the sunspot area is significantly smaller for the CME-less events compared to the CME-eruptive ones. The above-mentioned results may be used in future for predicting the duration and CME productivity of flare events. Furthermore, investigation of historical flare events and comparison to the present statistical results suggested a possibility that “superflares” might be possible on the Sun.
Toriumi, S., Schrijver, C. J., Harra, L. K., Hudson, H., and Nagashima, K. (2017), Magnetic Properties of Solar Active Regions that Govern Large Solar Flares and Eruptions, Astrophys. J.,
http://iopscience.iop.org/article/10.3847/1538-4357/834/1/56
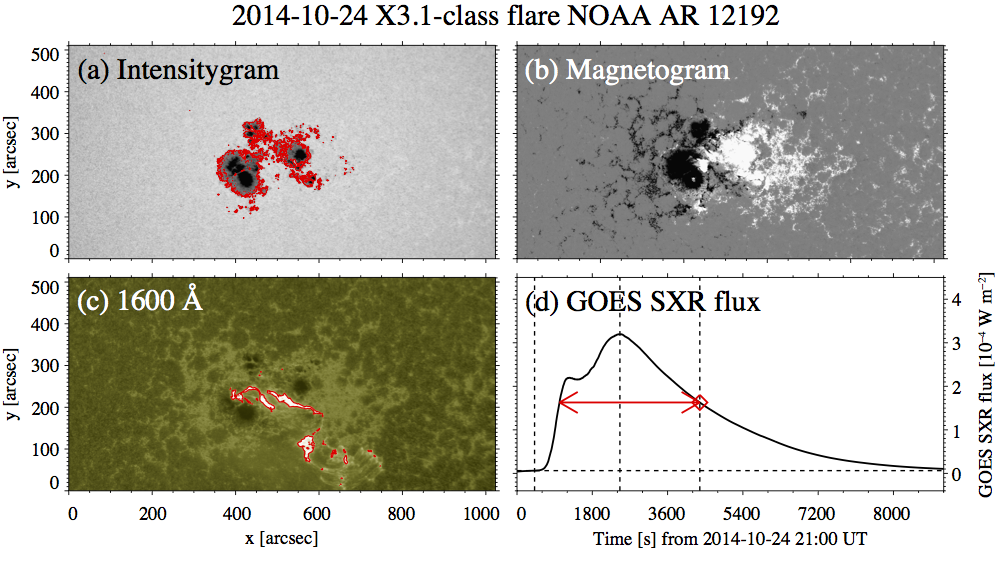
Figure 1. Sample flare data. X3.1-class event on October 24, 2014. (a) sunspots in white light. (b) Photospheric magnetic fields (white: positive, black: negative). (c) Flare ribbons observed in ultra violet. (d) Temporal evolution of soft X-ray intensity (arrow indicates the flare duration).
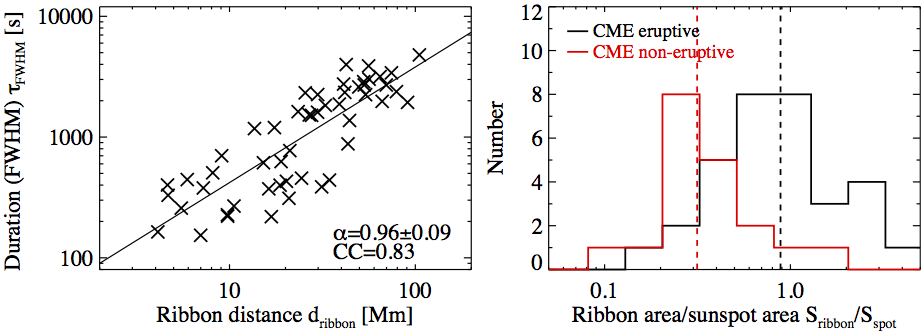
Figure 2. Representative statistical results. (Left) Scatter plot of the flare duration (vertical) versus the ribbon distance (horizontal). The duration is linearly proportional to the ribbon distance. Similar results were obtained for the ribbon area and the total magnetic flux inside the ribbon. (Right) Histograms of the ratio of ribbon area divided by spot area for the CME-eruptive (black) and non-eruptive (red) cases. Non-eruptive events show relatively small flare ribbons. Similar results were obtained for the ratio of total magnetic flux.
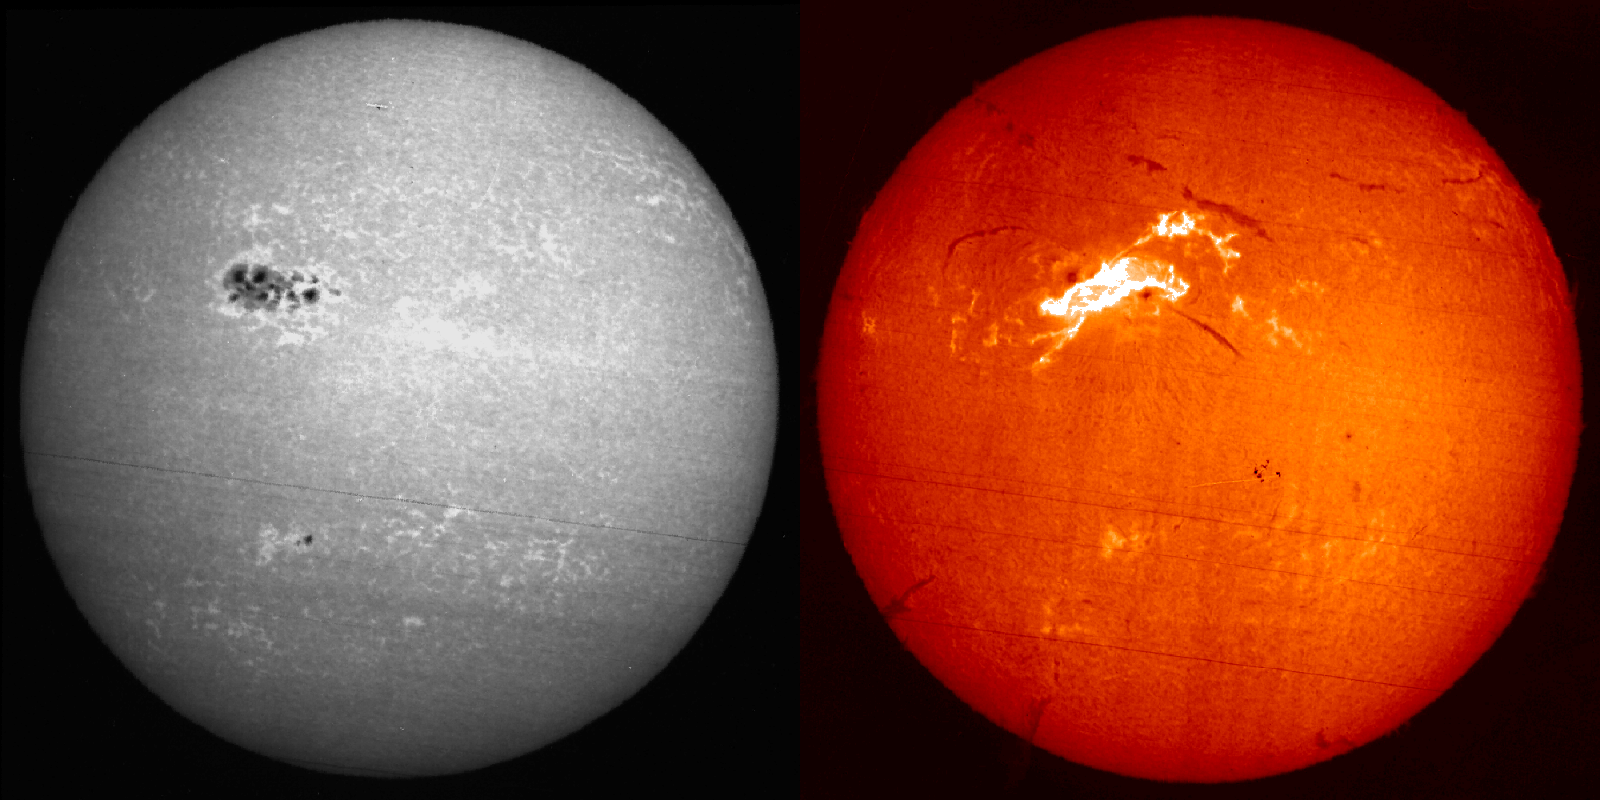
Figure 3. Great flare event on July 25, 1946. This event occurred in the 4th largest sunspot region since the late 19th century and produced perhaps the largest-ever-imaged sunspot-related flare ribbons. (Left) Sunspots observed in Ca line and (right) flare ribbons observed in H-alpha (images courtesy of Paris Observatory). Based on the statistical results, this sunspot region is estimated to have a magnetic flux of 1.5×10^23 Mx, while the magnetic energy contributed to the flare could be 8×10^33 erg. If the largest sunspot in history (April 1947: total flux estimated to be 2×10^23 Mx) is flaring, the energy could reach 1034 erg.