
Hiroyuki Shinagawa (National Institute of Information and Communications Technology)
In recent years, the prediction of EPBs (equatorial plasma bubbles) has been one of the most important issues in space weather forecasting because EPBs could affect communication and navigation systems. We have been developing a whole atmosphere-ionosphere coupled model GAIA (Ground-to-topside model of Atmosphere and Ionosphere for Aeronomy) in order to numerically predict ionospheric disturbances. In this study, the linear growth rates of the Rayleigh-Taylor (R-T) instability in the ionosphere from 2011 to 2013 were obtained with GAIA. The effects of thermospheric dynamics driven by atmospheric waves propagating from below on the R-T growth rate are included in the model by incorporating meteorological reanalysis data in the region below 30 km altitude. The daily maximum R-T growth rates for these periods are compared with the observed occurrence days of EPB determined by the Equatorial Atmosphere Radar (EAR) and Global Positioning System (GPS) in West Sumatra, Indonesia. We found that a high R-T growth rate tends to correspond to the actual EPB occurrence, suggesting the possibility of predicting EPB occurrences with GAIA.
Shinagawa, H., Y. Miyoshi, H. Jin, H. Fujiwara, T. Yokoyama, and Y. Otsuka (2018), Daily and seasonal variations in the linear growth rate of the Rayleigh-Taylor instability in the ionosphere obtained with GAIA, Progress in Earth and Planetary Science, 5:16 https://doi.org/10.1186/s40645-018-0175-8
https://progearthplanetsci.springeropen.com/articles/10.1186/s40645-018-0175-8
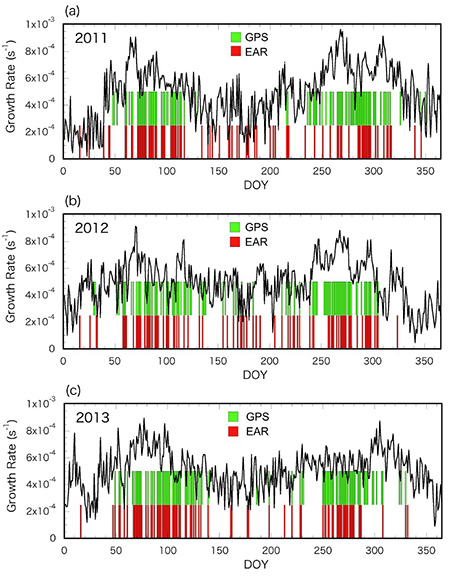
Figure 1: Daily variations in R-T growth rate obtained with GAIA. The daily maximum values of the R-T growth rate (black line) are obtained with GAIA at 100°E for the years of a 2011, b 2012, and c 2013. Vertical bars indicate the days when EPBs are detected by EAR (red bar) and by GPS (green bar)
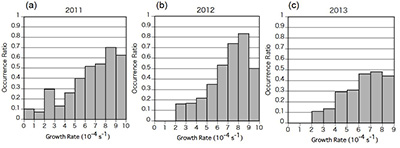
Figure 2: Histograms of the number of EPS occurrence/non-occurrence days for the R-T growth rate. The histograms indicate the relationship between the rate of days of EPB occurrence and the R-T growth rate ina 2011, b 2012, and c 2013