
Satoshi Inoue (Nagoya University)
The solar flares and coronal mass ejections (CME) are important phenomena for not only understanding of a basic process of solar plasma but also increasing of the accuracy of the space weather forecast. We often observed eruptions of a twisted flux tube, which is composed of helical twisted lines, associated with solar flares and CMEs. The understanding of a formation and dynamics of a solar eruptive flux tube is therefore important to understand the sequential dynamics from solar flares to CMEs.
In this paper, we performed magnetoydrodynamic (MHD) simulation to reveal the dynamics of solar eruptive flux tube associated with M6.6 flare observed on 2011 February 13. We, in particular, employed a nonlinear force-free field (NLFFF: See Science Nuggets No.6 & No.7), which is extrapolated from the observed photosphereic magnetic field, as the initial state to construct a realistic magnetic environment. As shown in Figure 1, the NLFFF has strong current in the central area of AR where the magnetic free energy is accumulated to possibly cause the solar flare. We first gave perturbations to the twisted lines formed in the NLFFF, the twisted lines then lose the equilibrium, resulting into that successfully showed dramatic eruption. Our simulation showed that the eruptive flux tube is accelerated rapidly even though it passes through a region predicted from theoretical model where the evolution of a flux rope should be suppressed. We found that the nonlinear interaction of the flux rope evolution and reconnection, which is not taken into account in a theoretical model, plays an important role in accelerating the flux rope.
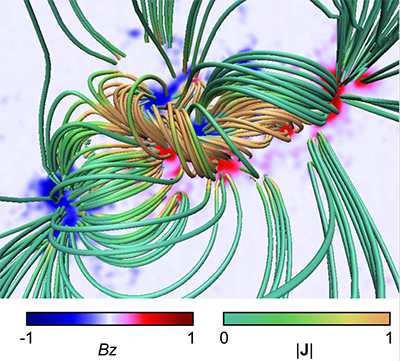
Figure:1. Three-dimensional magnetic fields extrapolated from the observed photospheric magnetic field where the extrapolation is exculted under a force-free approximation. The magnetic field used in this study was observed at 16;00 UT on 2011 February 13 which corresponds to 90 mins prior the flare occurring time. The background shows Bz component in blue-red and the color of the filed lines correspond to the value of the current density.
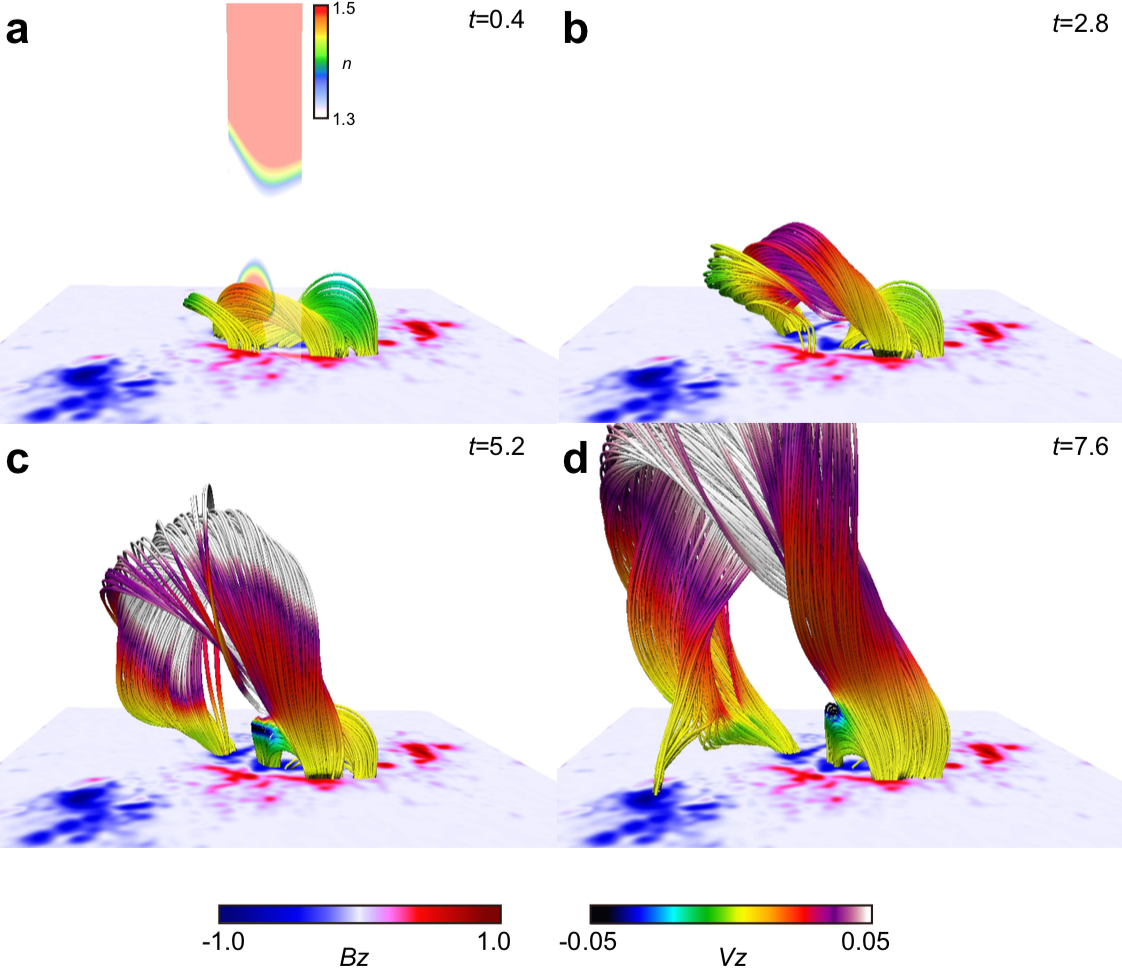
Figure2: A temporal evolution of the dynamics of the solar magnetic flux rope. The lines correspond to the vertical velocity (Vz) and the decay index is plotted on the vertical cross section. The decay index is derived from the theoretical model which predicts a location where the magnetic flux rope becomes unstable.
Satoshi Inoue, Kanya Kusano, Jörg Büchner, & Jan Skala, “Formation and Dynamics of Solar Eruptive Flux Tube”, Nature Communications 9, 174 (2018)
http://www.nature.com/articles/s41467-017-02616-8