
Daikichi Seki(Kyoto University)
Filaments, the dense cooler plasma floating in the solar corona supported by magnetic fields, often erupt and emit a bulk of plasma (Coronal Mass Ejection; CME) into the interplanetary space. Since a CME is a major source to drive a severe geomagnetic storm, it is also important to predict the occurrence of a CME from a space-weather point of view.
It has been empirically known that filaments generally exhibit certain activations before they erupt. First, by analyzing the unprecedented detailed line-of-sight (LOS) velocity (the velocity to/from the Earth) of a filament obtained by the Solar Dynamics Doppler Imager [1], we observed that the standard deviation of the LOS velocities of the small- scale motions in a filament increased prior to its eruption (see the figure 2) [2]. Taking it into account that the filament did not show any global movements, this result could reflect the filament activation prior to eruption.
Second, since it is unclear whether such an increase in the standard deviation of the LOS velocity is common in filament eruptions, we analyzed 12 filaments that vanished in Hα line center images in a manner similar to the one in our previous work; these included two quiescent filaments, four active region filaments, and six intermediate filaments [3]. As a result, we verified that in 9 events, the standard deviation of the LOS velocity increased before the filaments disappeared, whereas the average of the LOS velocity was roughly zero. Moreover, we observed that the leading time of prediction varies from several tens of hours to around one hour, probably depending on the surrounding magnetic fields. We concluded that the standard deviation of the LOS velocities of the small-scale motions in a filament can potentially be used as the precursor of a filament eruption.
Reference:
1. Ichimoto, K., Ishii, T. T., Otsuji, K., Kimura, G., Nakatani, Y., Kaneda, N., Nagata, S., UeNo, S., Hirose, K., Cabezas, D. P., & Morita, S. 2017, Sol. Phys., 292, 63
2. Seki, D., Otsuji, K., Isobe, H., Ishii, T. T., Sakaue, T., Hirose, K. 2017, ApJ, 843, L24
3. Seki, D., Otsuji, K., Isobe, H., Ishii, T. T., Ichimoto, K., Shibata, K. 2019, arXiv:1902.08718, PASJ (in press)
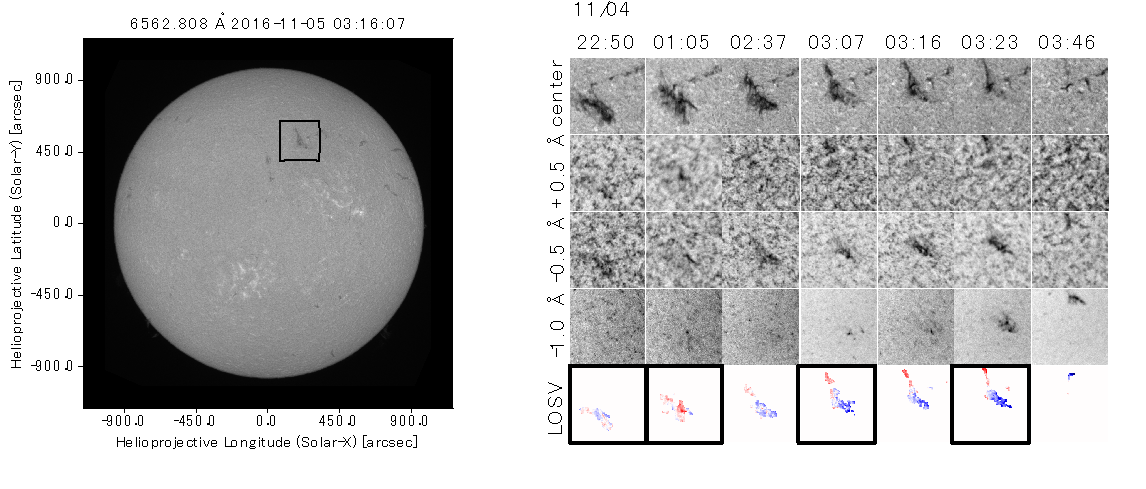
Figure 1: Solar full-disk image observed in Hα line center (left) and the snapshots of the filament observed in four wavelengths and its line-of-sight velocity (LOSV) map (right). We can see that the erupting filament was observed as a dark feature in shorter wavelengths (-0.5 Å and -1.0 Å). Color scale of the LOSV map is equivalent to that of the right panels in Figure 2.
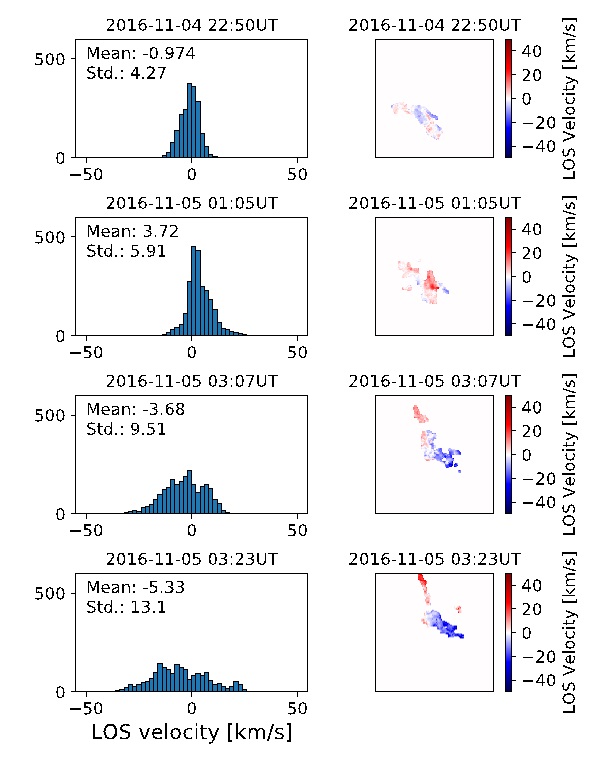
Figure 2: Line-of-sight velocity maps (right) and their histograms (left). Each histogram corresponds to the right image. Each bin represents 2 km/s. It can be seen that the standard deviation of the LOS velocity increased with the lapse of time. Note that the LOS velocity map on each right panel is shown with a scale of lower and upper limits of ± 20 km/s.