
Shinsuke Imada (Nagoya University)
Plasma in the solar corona is believed to be the thermal equilibrium condition because of the weak coulomb collision. So far, many study discuss the plasma dynamics in solar corona with the thermal equilibrium assumption. Because the time cadence is not enough, most observation in the solar atmosphere can be interpreted with the thermal-equilibrium assumptions. The time resolution becomes very high, especially for spectroscopic observation after Hinode. Thanks to Hinode observation, we can discuss the thermal non-equilibrium conditions, such as non-equilibrium ionization. Imada et al. 2015 has studied the chromospheric evaporation flow during the impulsive phase of the flare by using the Hinode/EUV Imaging Spectrometer observation and 1D hydrodynamic numerical simulation coupled to the time-dependent ionization. The observation clearly shows that the strong redshift can be observed at the base of the flaring loop only during the impulsive phase (Fig 1 & 2). By comparison with numerical calculation, they conclude that the time-dependent ionization effect is important to reproduce the strong downflows in FeXII and FeXV (Fig3).
Imada, S., I. Murakami, and T. Watanabe, Observation and numerical modeling of chromospheric evaporation during the impulsive phase of a solar flare, Phys. Plasma, 22, 101206, 2015.
http://aip.scitation.org/doi/10.1063/1.4932335
「ひので」衛星により見え始めた熱的非平衡プラズマ、天文月報, 第109巻, 第9号, 637−641.
http://www.asj.or.jp/geppou/archive_open/2016_109_09/109_9_637.pdf
Imada, S., Thermal Non-equilibrium Plasma Observed by Hinode, Astrophysics and Space Science Library in press.
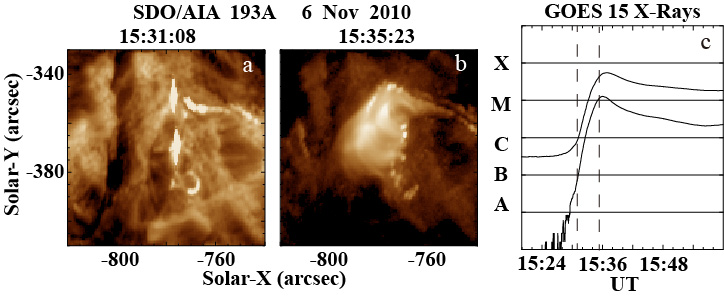
Fig1: The flare image of AIA 193 A channel at the impulsive (a) and the peak (b) phase. The light curve of GOES 1.0-8.0 and 0.5–4.0A are also shown in Figure 1(c). The dashed vertical lines show the acquired time of the AIA images ((a): impulsive, (b): peak).
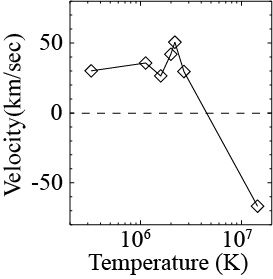
Fig2: The temperature dependence of the chromospheric evaporation upflow/condensation downflow during the impulsive phase of the flare. The LOSvelocities are estimated by Doppler shifts.
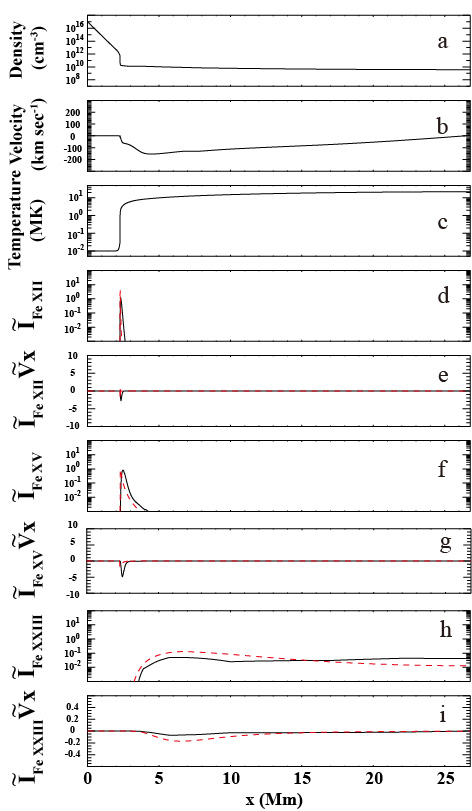
Fig3: The result of the simulation during the flare. The normalized intensities of FeXII (d) and FeXV (f) and FeXXIII (h) are shown. The black solid line shows the result with time-dependent ionization calculation, and the red dashed lines show the result with ionization equilibrium assumption. We also show the flux of Fe XII (e), Fe XV (g), and Fe XXIII (i) in each height, which represents the Doppler shift contribution parameter in each emission lines. Downward motions in FeXII and FeXV are clearly shown.