
The 11-year cyclic activity of the Sun, which is traditionally indicated by the sunspot numbers, shows up in various phenomena that occur in the Sun. Since the sunspots form from the magnetic field created inside the Sun, the amount of magnetic field (magnetic flux) also varies with an 11-year cycle. Even when sunspots disappear, the magnetic flux does not entirely vanish; about 20% of the magnetic flux of the sunspot maximum period remains in the minimum period. X-ray and ultraviolet emission varies significantly; the X-ray intensity at the activity maximum is more than 100 times that of the activity minimum. In the minimum period, the high-speed solar wind flows out from high latitude areas, along magnetic field lines that are open to the interplanetary space. At the maximum, such open magnetic flux decreases and the wind is dominated by the slow-speed wind.
Using the X-ray images taken with the Yohkoh satellite launched in 1991 and operated until 2001, the US Yohkoh team produced an impressive poster showing the variations of the solar corona seen in X-rays (a). The corresponding maps of the magnetic field distribution was produced by the US National Solar Observatory (NSO) using data from the magnetograph at Kitt Peak, Arizona (b). The Solar-Terrestrial Environment Laboratory (STEL, the predecessor of ISEE), Nagoya University, created velocity distribution maps of the solar wind (c).
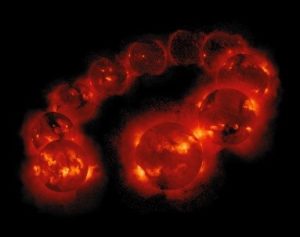 (a) X-rays |
 (b) Magnetic field |
 (c) Solar wind |
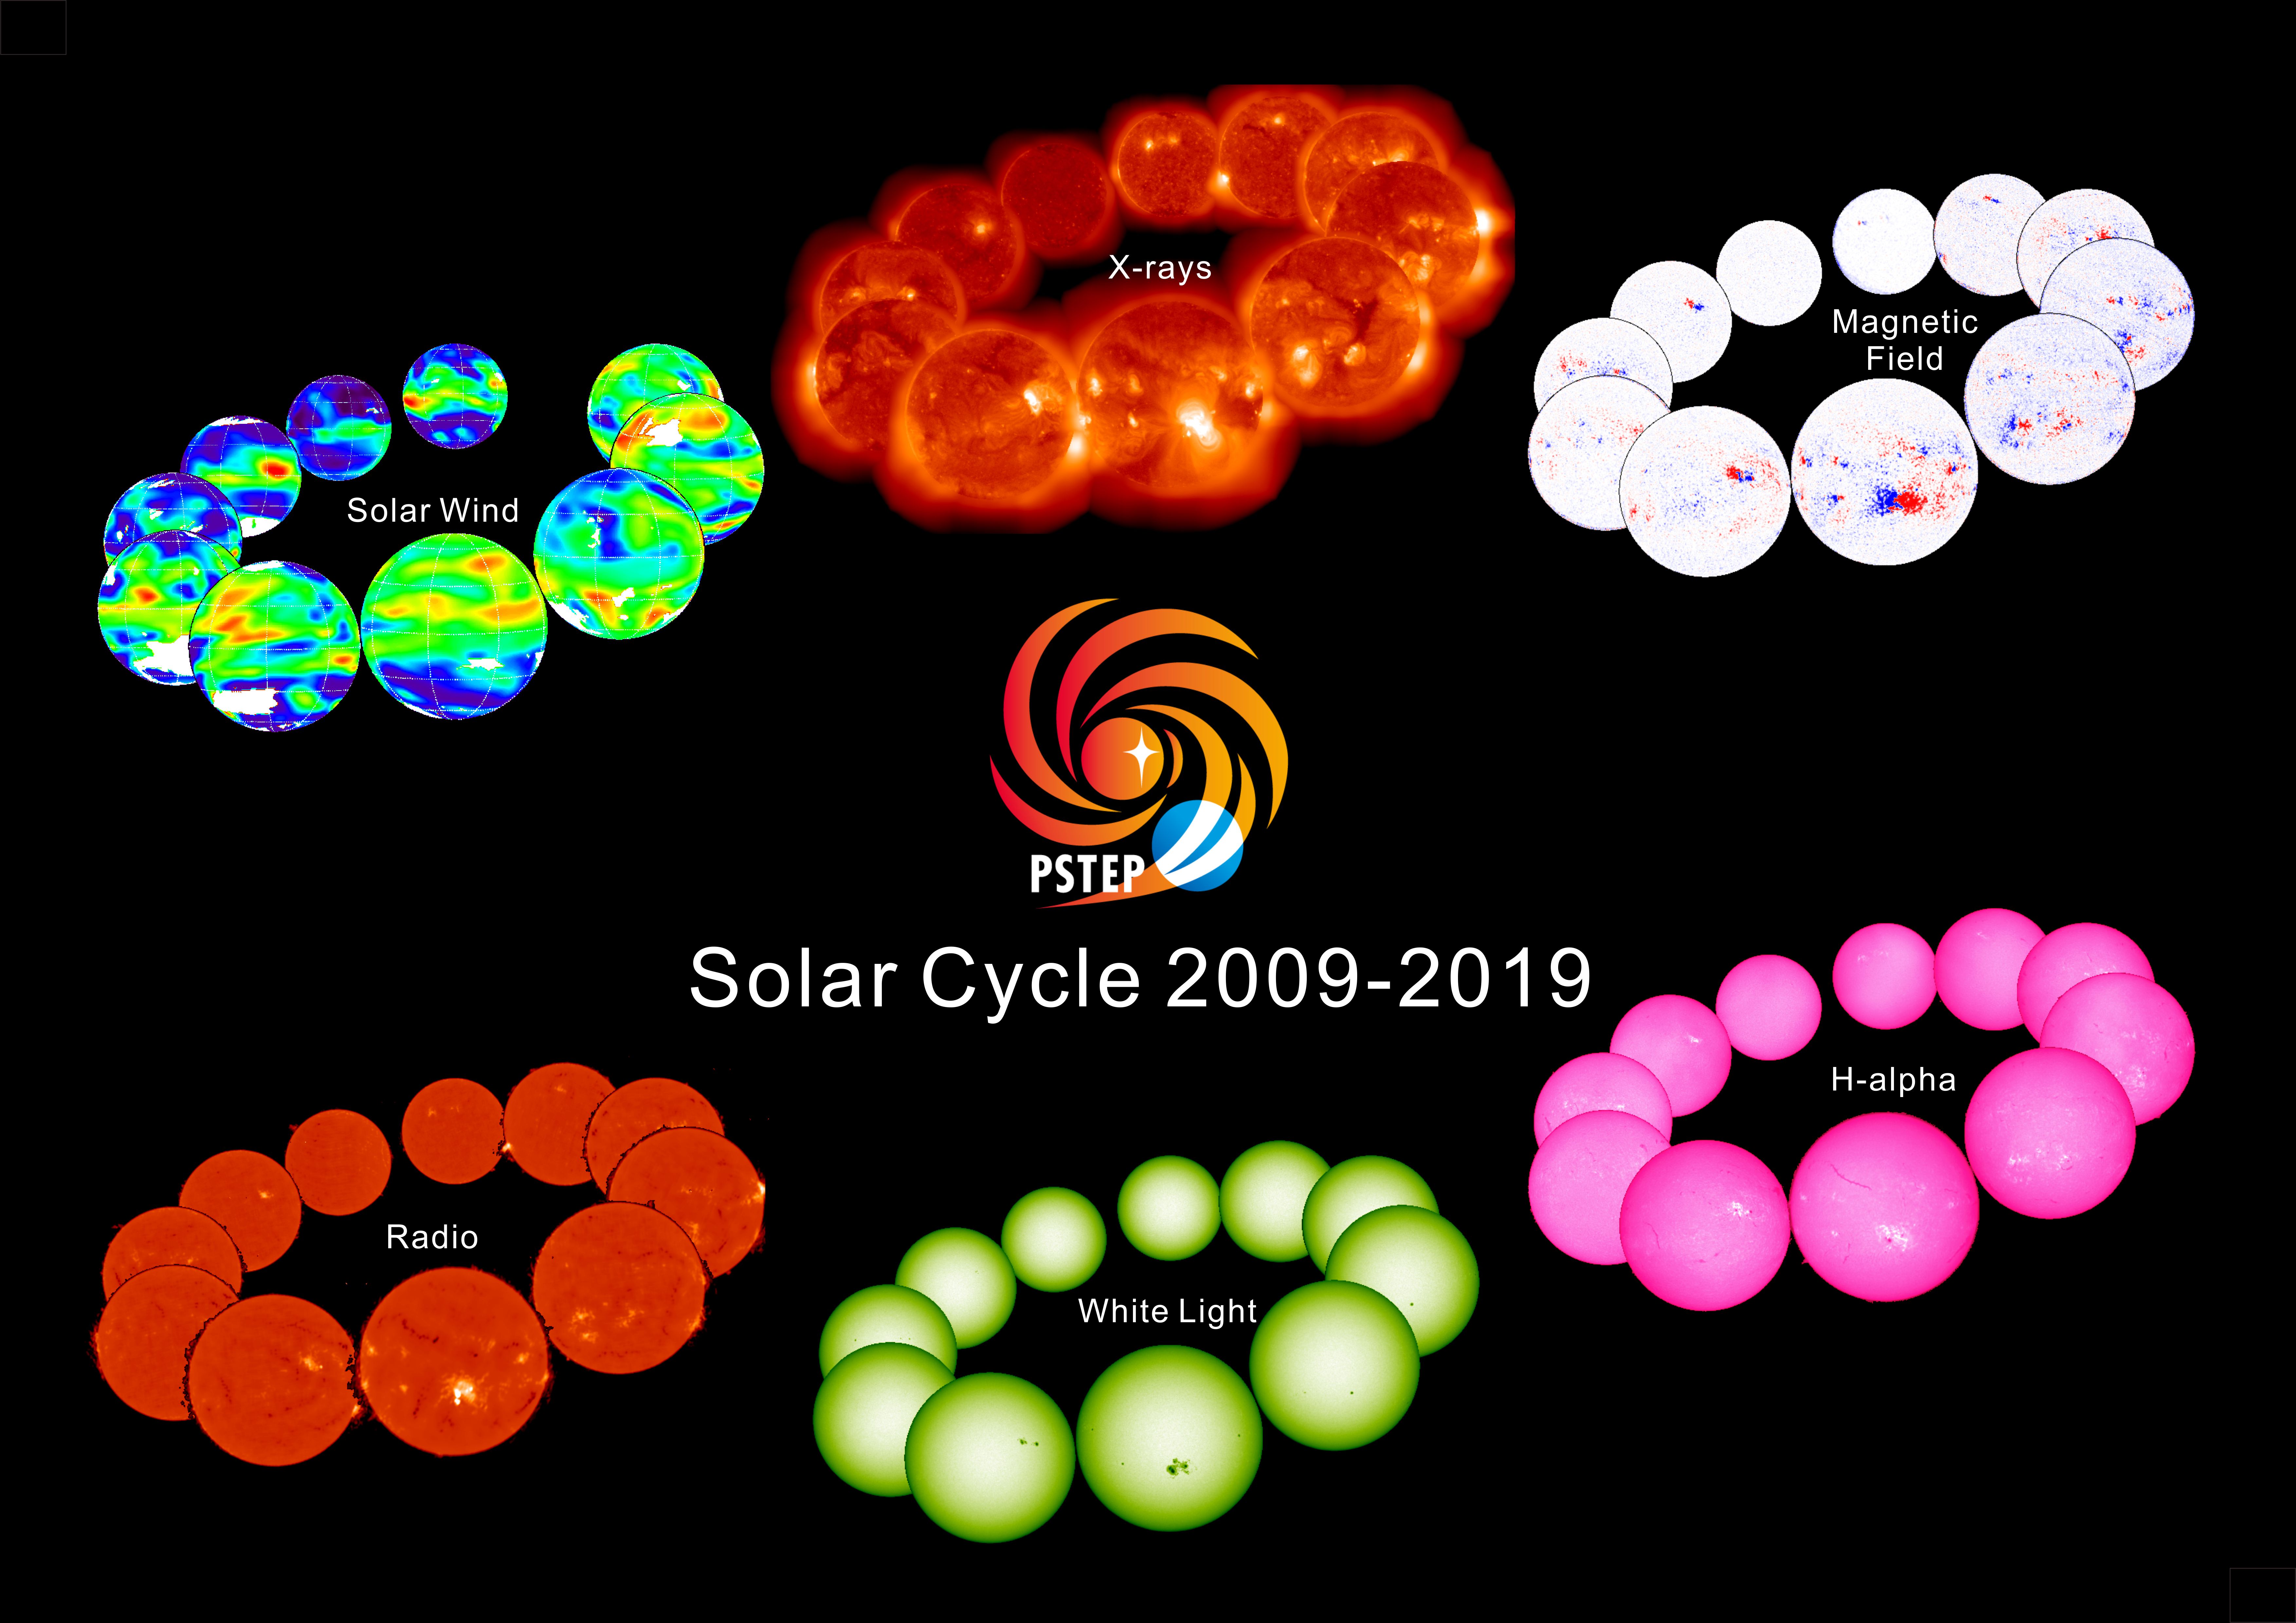
For the period of 2009-2019 (the 24th Solar Cycle), including the five years of PSTEP, we have produced a new poster with the same design. The X-ray data are from Hinode instead of Yohkoh, and the solar wind data are from the Institute for Space-Earth Environmental Research (ISEE), Nagoya University, as before. The magnetic field and white light data are from National Astronomical Observatory of Japan, at Mitaka, Tokyo. The radio images are by the Nobeyama RadioHeliograph, Nobeyama Solar Radio Observatory of the National Astronomical Observatory of Japan (currently operated by an international consortium led by Nagoya University), and the Hα images are from Hida Observatory, Kyoto University. Please note that all data are made in Japan, including those from international joint projects led by Japan such as Hinode.
Solar Cycle 2009-2019 POSTER Downroad here
Details on data sources
Takashi Sakurai (NAOJ), PSTEP A04 Team