The distribution of coronal holes over the last 40 years
[2016-09-06]
In a collaboration with Chubu University, we developed an automated prediction technique for coronal holes using potential magnetic field extrapolation in the solar corona using synoptic magnetogram data obtained at Kitt Peak National Solar Observatory (USA).
We found that the long-term distribution of coronal holes from 1975 to 2014 shows a similar pattern known as the magnetic butterfly diagram.
The results have appeared in the research highlights of American Astronomical Society.
Journal: The Astrophysical Journal Letters
Title: Long-term Trend of Solar Coronal Hole Distribution from 1975 to 2014
Authors: K. Fujiki(ISEE), M. Tokumaru(ISEE), K. Hayashi(ISEE), D. Satonaka(ISEE), and K. Hakamada(Chubu University)
URL: http://iopscience.iop.org/article/10.3847/2041-8205/827/2/L41
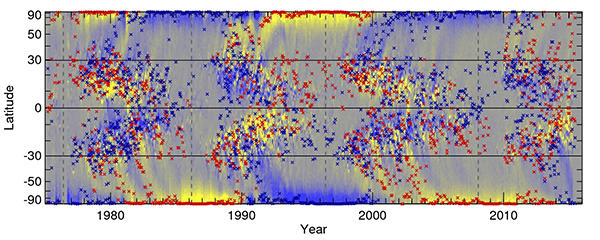
Figure: Latitude distribution of coronal holes. The “x” mark represents the COG latitude of each coronal hole. The background color image is the magnetic butterfly map (Hathaway 2010) scaled as −10 G (blue), 0 G (gray), and 10 G (yellow). The latest version is available at http://solarscience.msfc.nasa.gov/images/magbfly.jpg.